Designing an Eval Platform for AI Agents: Proving a Change Helped
How to tell whether a prompt or model change made an agent better when every run scores differently: task suites, sandboxes, graders, error bars, paired comparisons and a CI release gate.

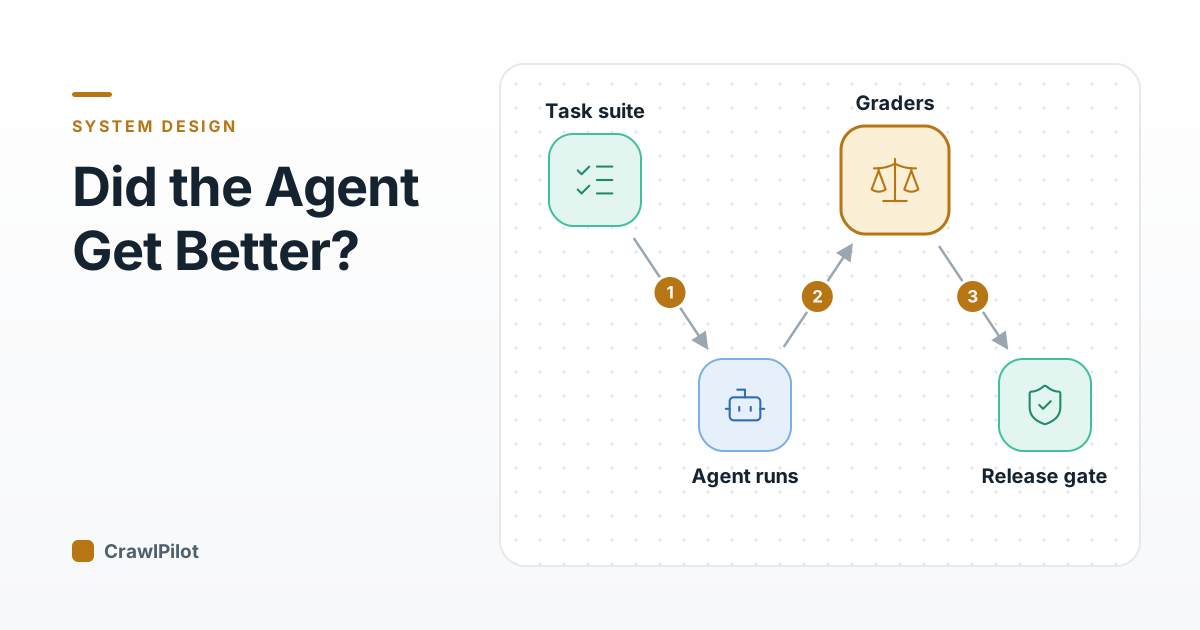
Say version B of your support agent passes 74 of 100 tasks this morning, and version A passed 70 of the same suite last week. The pull request says "+4 points" and everyone is pleased. Do the arithmetic first: at a 70% pass rate over 100 tasks, the standard error of one score is √(0.7 × 0.3 / 100), about 4.6 points. Two independent scores like that differ by a standard error of roughly 6.3 points, so the 95% interval on "B minus A" runs from about −8 to +16. The four points could be real. They could also be the agent getting lucky on a Tuesday.
That is the design pressure for an evaluation platform. Prompts change daily, model providers ship new snapshots, tools return slightly different things, and the agent samples its way through every task. A platform that reports one number per run will keep celebrating noise and occasionally ship regressions. One that reports a number with an honest error bar, and knows how to shrink that bar cheaply, lets a team move fast without guessing.
Run It Again and Watch the Winner Change
Before any architecture, feel the problem. Below, version B is genuinely better than A (you set by how much). Each press of Run eval draws a fresh set of tasks and runs both versions once per task, the way a CI job would. Watch how far the dots wander, and how often the "winner" flips.
Dots are past runs; the dark dot and bar are the latest run and its 95% confidence interval. The dashed line is the true value, which a real eval never shows you. Simulated: each task gets a random difficulty, so pass rates and outcomes here are illustrative.
At the defaults, B comes out ahead in roughly seven runs out of ten, and the 95% interval on the gap clears zero in only about one run in ten (from 2,000 runs of this simulator; your clicks will vary). A team that ships whenever B "wins" is flipping a weighted coin. Now try three things: push the tasks to 500, raise samples per task to 5, then switch on Paired. Each one tightens the dots. Pairing helps little at one sample per task and noticeably at five, and the reason why is the core of the statistics section further down.
One Eval Run, From Task to Score
An eval run is an experiment with a fixed protocol. Every part of the protocol is something you pin, version and store, because you will want to explain a score change three weeks later.
- The harness loads one pinned version of the suite: each task has an input, a starting environment state and a definition of success.
- For each of N tasks it starts k independent trials. Every trial gets a clean sandbox, so one trial's writes can't leak into the next.
- The agent works the task. Its tool calls hit either a replay layer serving recorded responses or, in the live suite, the real service.
- Every step lands in the trace store: messages, tool calls and results, tokens, latency, cost, plus the exact agent config hash.
- Graders read the stored trajectory and the final environment state, never the live agent, so grading can be rerun or replaced later without rerunning the agent.
- Per-task scores (the mean over k trials) roll up into a pass rate with a standard error, and into a paired diff against the baseline version.
6 steps. Press Play to walk through them, or click any part of the diagram.
Two choices in that picture matter more than they look. Graders reading stored traces (step 5) means a better grader can rescore last month's runs for free. And scoring the final environment state, not just the agent's last message, is what makes agent evals different from chatbot evals. The τ-bench benchmark does exactly this: it compares the database state at the end of a conversation with an annotated goal state, so an agent that says "your booking is changed" without changing it fails.
The harness also has to tell an agent failure from an infrastructure failure. A sandbox that failed to boot, a model API that returned a rate-limit error, a replay server that timed out: none of these say anything about the prompt under test. Count them as errored, retry them with backoff, and exclude them from the pass rate while reporting how many there were. Scoring them as failures adds noise that has nothing to do with the agent, and it lands unevenly, because the version tested during a provider's bad hour looks worse. A version whose errored count climbs (more timeouts, longer trajectories hitting the step limit) is a finding, so the count goes on the report next to the score.
Seeds help less than people expect. Seeding the harness fixes which tasks run and in what order, and seeding the sandbox makes its starting state reproducible, but a hosted model's sampling isn't something you can seed reliably. Plan for run-to-run variation from the model and measure it, rather than assuming a seed removed it.
Where the tasks come from
A suite built from one source has one blind spot. Mix three, and seal some away.
- Curated tasks cover what the product promises, each with a clear success check. They are expensive to write and drift away from what users actually ask.
- Production traces fix that drift: a failed or escalated conversation becomes a task, with its tool responses recorded at the time.
- Adversarial tasks probe what users rarely do but attackers will: injected instructions in tool output, ambiguous requests, tasks that should be refused.
- After scrubbing personal data and merging near-duplicates, most tasks join the working suite. A slice goes into a holdout the team never tunes against.
4 steps. Press Play to walk through them, or click any part of the diagram.
Production traces need the most care. They carry customer data, so scrubbing happens before a trace becomes a task, and the recorded tool responses are scrubbed with it. For the injection side of the adversarial set, the prompt injection defense post has the threat model to draw tasks from.
Replay the Tools or Call Them Live
An agent that books flights, edits tickets or browses sites touches systems that change on their own. That is the single biggest source of noise you can remove by design.
- Same response every run, so score changes come from the agent
- Fast and cheap, with no rate limits
- Safe for tools that write data or spend money
- A tool call the recording never saw has no answer
- Goes stale as the real service changes
- Catches API and website changes
- Tests the real error paths and latency
- Scores move when the world moves
- Slow and costly at k samples per task
- Side effects need a sandboxed account
Verdict: Gate merges on replayed tools; run a smaller live suite on a schedule to find out when the recordings have gone stale.
The hard case on the replay side is a call the recording has never seen, because the new prompt made the agent ask something different. Don't silently return an error, which punishes the new version for being different. Mark the trial unreplayable, report how many there were, and route those tasks to the live suite. If a version's unreplayable count jumps, that is a finding in itself.
Grading the Outcome, the Path, or Both
Three kinds of grader cover most of what an agent does, in order of preference.
| Grader | How it decides | Use it for |
|---|---|---|
| Programmatic check | Code compares the final state or output with the expected one: a row exists, a JSON field matches, the tests pass | Anything with a checkable end state. Cheap, exact and never drifts |
| Rubric model grader | An LLM scores the transcript against a written rubric with examples | Tone, helpfulness, whether a refusal was right: things code can't check |
| Pairwise model grader | An LLM sees two versions' answers to the same task and picks one | Comparing versions where absolute scores are fuzzy |
Then the question of what to grade: only where the agent ended up, or how it got there.
- Matches what the user cares about
- Leaves the agent free to find a better path
- Usually a programmatic check
- Misses dangerous detours that happened to end well
- Says nothing about cost or wasted steps
- Catches a forbidden tool call, even on success
- Explains why a task failed
- Can score efficiency in steps and tokens
- Brittle if it demands one exact path
- Usually needs a model grader
Verdict: Pass or fail on the outcome; add trajectory checks as hard constraints (never call refund twice, never email before confirming) and report steps and cost beside the score.
The trajectory checks worth having are rules, not paths: things that must never happen and budgets that must not be blown. Grading against one golden path punishes an agent for finding a shorter route.
One more metric changes how you read a pass rate. With k trials per task, "solved at least once" (pass@k) flatters an agent, while "solved every time" measures what a user feels. τ-bench calls the second pass^k, and reports that agents built on strong function-calling models were inconsistent enough that pass^8 fell below 25% in its retail domain. For an agent that acts for customers, report pass^k beside the mean.
Keeping the Model Grader Honest
A model grader is a measuring instrument, and you would not trust a scale you had never checked against a known weight. The MT-Bench study found strong LLM judges agree with human preferences over 80% of the time, about the rate at which humans agree with each other, and also documented position, verbosity and self-enhancement biases. Both halves matter: model graders can work, and they lean in predictable directions. So the platform runs a calibration loop before a grader goes into the gate, and again whenever the rubric, the grader model or the agent changes.
- People label a stratified sample of transcripts against the same rubric the model will use, without knowing which agent version produced them.
- The model grader scores the same transcripts. For pairwise grading, run each pair in both orders and only count verdicts that survive the swap.
- Compare per transcript, using agreement beyond chance (such as Cohen's kappa) rather than raw percent agreement, which looks high whenever most transcripts pass.
- Read every disagreement. Most trace to a vague rubric line, a missing example or a bias such as preferring the longer answer. Fix the rubric and grade again.
- Once agreement holds on a fresh sample, pin the grader: model snapshot, rubric version and prompt hash go into every score it produces.
5 steps. Press Play to walk through them, or click any part of the diagram.
Step 5 is the one teams skip. A grader version is part of the measurement. Change it and every historical score it produced is on a different scale, so a dashboard that mixes grader versions shows trends that aren't there. Store the grader version beside each verdict and rescore the baseline whenever the grader changes, which the stored traces make cheap.
How Many Tasks Make a Difference Visible
The statistics are the part most eval setups skip, and the part that saves the most arguments. The clearest treatment I know is Evan Miller's Adding Error Bars to Evals (2024), which treats each eval question as drawn from an unseen population of possible questions. Its recommendations, applied to agents:
- Report the standard error beside every pass rate, computed from the per-task scores with the central limit theorem.
- Cluster when tasks are related. If 20 tasks share one website or one document, they are not 20 independent draws; the paper shows how to use clustered standard errors.
- Take several samples per task and average them. This removes the trial-to-trial luck, up to the point where the remaining variance comes from tasks genuinely differing in difficulty.
- Don't lower the temperature to cut noise. The paper advises against it unless you mean to study the model at that temperature: it can shift variance into the per-task success rates, where resampling can't touch it, or add bias.
- Compare two versions on the same tasks with paired differences. Score B minus A per task and take the standard error of those differences. When the two versions find the same tasks hard, which the paper expects to be common, the shared difficulty cancels and the error bar shrinks.
- Run a power analysis before building the suite. The paper's worked example (a 3-point difference, 5% significance, 80% power, paired) needs about 969 questions, and it recommends new evals have at least 1,000.
That explains the simulator. Paired scoring cancels task difficulty, but at one sample per task the per-trial coin flip dominates and there is little shared difficulty left to cancel. At five samples the coin flips average out, the difficulty component is most of what is left, and pairing removes it. Resampling and pairing compound.
Try your own suite size here. The calculator uses the binomial standard error, √(p(1−p)/n), split into a difficulty part and a luck part as described in its note.
Not detectable: a 4-point gain hides inside the noise. You need about 1,974 tasks at 1 sample each, more samples per task, or a paired comparison.
Normal approximation to the binomial. Assumes a third of each task's single-sample variance is task difficulty (more samples can't remove it) and two thirds is run-to-run luck, as in Miller's uniform-difficulty example; your split will differ, so measure it from repeated runs. Unpaired comparison at 80% power, so it is conservative: scoring both versions on the same tasks and testing the per-task differences needs fewer tasks when their scores are correlated. Ignores clustered tasks, which need clustered standard errors and more tasks.
At the defaults, a 200-task suite with one sample per task can't see a 4-point gain: the smallest gain it reliably detects is over 12 points. Five samples per task brings the requirement from about 2,000 tasks to about 900 under the calculator's assumption, and pairing on the same tasks lowers it further. Most teams' suites are far smaller than either number, which is why so many prompt "improvements" never reproduce.
The Gate Between a Prompt Change and Production
With error bars in hand, the release gate becomes a rule you can write down. The trick is cost: a full suite at k samples per task, with model graders, is too slow and expensive to run on every commit. So the suite is tiered.
- Every push runs a smoke suite: a few dozen must-pass tasks on replayed tools, programmatic graders only. Minutes, not hours. Any failure blocks.
- Before merge (or nightly for a busy repo) the full suite runs: every task, k samples each, on the same task versions as the baseline.
- The gate computes the per-task difference against the current production version and its confidence interval, clustered where tasks are grouped.
- Ship when the interval's lower bound sits above a small allowed regression (a margin the team picks), cost and latency stay inside budget, and pass^k on critical tasks hasn't dropped.
- Otherwise block, and show the tasks that flipped from pass to fail with their two traces side by side. That diff is what the engineer actually needs.
5 steps. Press Play to walk through them, or click any part of the diagram.
Notice what the gate asks. It doesn't ask "is B better?", which at most suite sizes has no confident answer. It asks "can we rule out B being meaningfully worse?" That question can be answered with a few hundred tasks, it matches the real decision (prompt refactors and model upgrades mostly need to be not worse), and it stops the gate from rejecting every change for lack of evidence.
The margin is a product decision, written down before the run. One or two points of pass rate is a common kind of choice for a refactor (the numbers here are illustrative, not a standard); a change that exists to improve a metric should instead have to show its interval sitting above zero. Whatever the margin, the suite has to be big enough for the interval to be narrower than it, which is what the calculator above is for. A margin narrower than the suite's noise floor blocks every change, and teams respond by rerunning until the gate goes green, which defeats it.
Cost control comes from four places, none of which touches the statistics:
- 01Tiers. Smoke on every push, full suite before merge or nightly, live-tool suite and sealed holdout weekly.
- 02Reuse the baseline. The production version's scores don't change when someone else's PR does, so store them once per suite version and only run the candidate. Rescore only when the suite or the grader changes.
- 03Cache graders, never the agent. A grader verdict keyed on the transcript hash and grader version is safe to reuse. Caching agent outputs would hide exactly the run-to-run variation you are trying to measure.
- 04Power-sized subsamples. For a quick read on a PR, a stratified subsample is fine as long as a power analysis says what it can detect, and the PR comment says so too.
What Gets Stored, and Why Diffs Beat Dashboards
Every trial is a row you will come back to: suite version, task id, trial index, agent config hash (prompt text, model snapshot, tool schemas, temperature), seed, tool mode (replayed, live or unreplayable), the full trajectory, every grader verdict with its grader version, tokens, latency and cost. Traces are large and mostly read when something breaks, so the trajectory goes to blob storage and the scores and keys go to a table you can query.
The query that pays for all of it is the flip list: tasks that passed under A and failed under B (and the reverse), each opening into the two trajectories side by side. A pass-rate chart tells you something moved. The flip list tells you what, and it is the paired comparison made readable. The same storage serves the RAG agent platform's debugging story: a bad answer is explainable only if its steps were kept.
After Release: Drift and an Eval Set That Goes Stale
Passing the gate says the agent was fine on last month's tasks. Production keeps moving: users ask new things, tools change their responses, a provider alias starts pointing at a new model snapshot. And the suite itself quietly degrades as a measuring instrument.
Drift monitoring reuses the graders. Sample a slice of production traces each day, run the reference-free graders on them (programmatic checks that need no expected answer, such as "did the tool call validate", plus the calibrated model grader), and chart the pass rate with its error bar. Alert when it falls outside its recent range by more than the noise explains, not on every wiggle. Pin model snapshots by their dated identifier rather than a moving alias, so a provider update shows up as a config change you chose.
Contamination and overfitting are the slower failure. Every time someone reads a failing task and tweaks the prompt to fix it, the suite becomes a little less of a test and a little more of a training set. Few-shot examples copied from suite tasks, a fine-tune whose data included traces that later became tasks, and a gate checked twenty times a day all leak the answers. Defenses that work:
- Keep the sealed holdout out of every prompt, dashboard and debugging session, and run it rarely. A widening gap between suite and holdout scores means you are tuning to the suite.
- Put a unique canary string in every task file so you can search prompts and training data for leaks.
- Rotate fresh production failures in and retire tasks every version solves, so the suite keeps measuring the frontier of what breaks.
- Treat the gate as a decision, not a search: rerunning until it passes is the same as raising the false-positive rate.
Q1Version B scores 74% and version A 70% on 100 tasks, one trial each. What should the gate conclude?
Q2Why does pairing barely help at one sample per task but help a lot at five?
Q3Which cache is safe in an eval platform?
One Page to Keep
Measure
- Report every pass rate with its standard error; one number alone invites celebrating noise.
- Take several samples per task; don't lower the temperature to fake stability.
- Compare versions on the same tasks with per-task differences.
- Size the suite with a power analysis; Miller suggests at least 1,000 questions for new evals.
Environment
- Fresh sandbox per trial; grade the final environment state, not the last message.
- Replay recorded tool responses in the gate; run a smaller live suite on a schedule.
- Mark unseen tool calls unreplayable and count them; don't fake an error.
Graders
- Prefer programmatic checks; use model graders for what code can't judge.
- Calibrate model graders against blind human labels, agreement beyond chance.
- Run pairwise judgments in both orders; pin the grader version on every verdict.
- Grade the outcome; add trajectory rules as hard constraints, and report pass^k.
Gate
- Smoke suite on every push, full paired suite before merge, live and holdout weekly.
- Ship when the CI lower bound clears a small regression margin, within cost and latency budgets.
- Block with the list of tasks that flipped, traces side by side.
Over time
- Sample and grade production daily; alert on moves bigger than the error bar.
- Turn production failures into tasks; retire tasks every version solves.
- Keep a sealed holdout and canary strings to catch contamination.
Sources
- Evan Miller, Adding Error Bars to Evals: A Statistical Approach to Language Model Evaluations, arXiv 2411.00640, November 2024. Standard errors, clustering, resampling, temperature, paired differences and power analysis.
- Shunyu Yao et al., τ-bench: A Benchmark for Tool-Agent-User Interaction in Real-World Domains, arXiv 2406.12045, June 2024. Final-state grading and the pass^k metric.
- Lianmin Zheng et al., Judging LLM-as-a-Judge with MT-Bench and Chatbot Arena, arXiv 2306.05685, 2023. Judge agreement with humans and its biases.

